Strategy Group Strategy
Our long-term strategy remains consistent, clear and focussed. Its five core pillars have served to underpin our success, helping to build a resilient and innovative organisation with exceptional customer service and a strong brand.
Our strategic approach
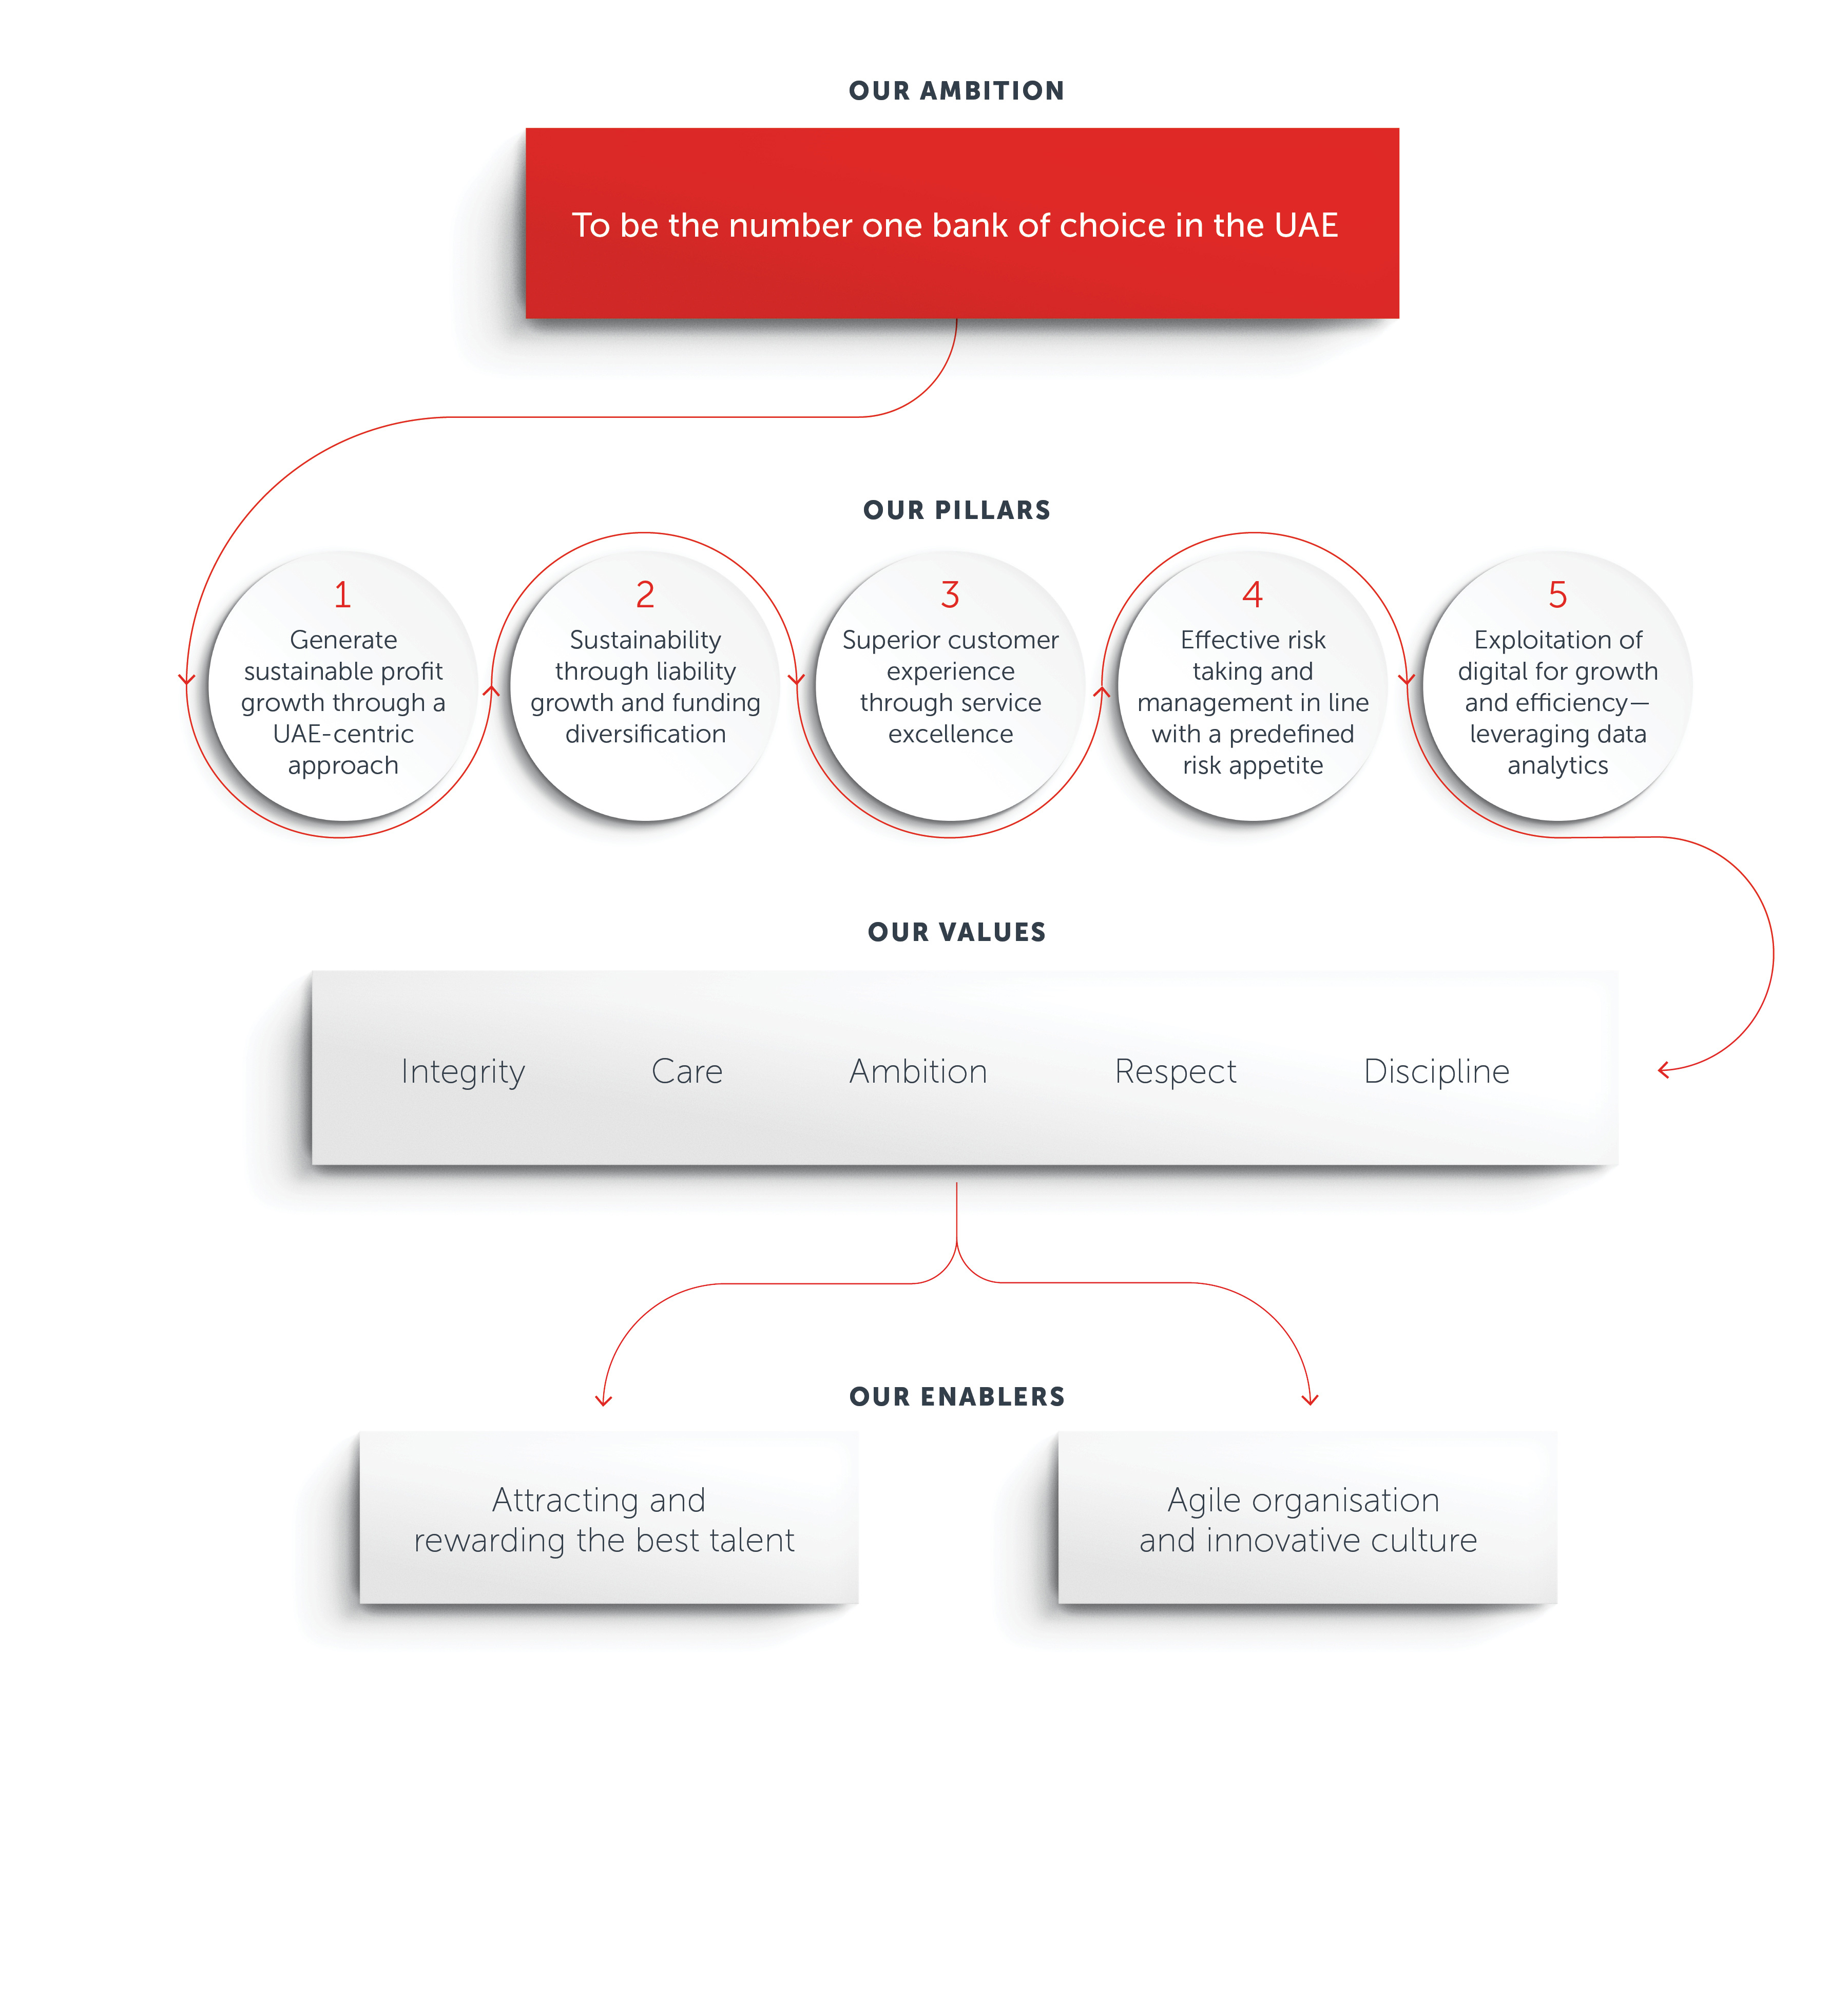
Strategic pillars
| OUR STRATEGIC PILLARS | HOW WE ACHIEVE THEM | WHAT WE DID IN 2018 | |
|---|---|---|---|
| 1 | Generate sustainable profit growth through a UAE-centric approach | We are committed to the UAE and its economy. It provides a dynamic, growing market with great ambition and significant long-term business potential as it continues to diversify. Dedicating ourselves to this one market gives us a sharp focus on the developing needs of our customers. |
|
| 2 | Sustainability through liability growth and funding diversification | We have a diversified liability base with increasing customer deposits. Loan growth is funded through growth in customer deposits, which resulted in a significant improvement in our loan-to-deposit ratio since the launch of our strategy. |
|
| 3 | Superior customer experience through service excellence | By providing exceptional service and ensuring a consistent cross- platform experience, we anticipate the changing needs of our customers and set ourselves apart from our competitors. |
|
| 4 | Effective risk-taking and management in line with a predefined risk appetite | Our disciplined approach to risk management is fundamental to protecting the Bank’s long-term financial strength and has given us the flexibility to adjust to the challenges of the operating environment. |
|
| 5 | Exploitation of digital for growth and efficiency — leveraging data analytics | We harness digital technology to simplify the client experience and improve the ecosystems for all our customers. Using technology in the right way helps us to serve our customers better, enabling faster, more secure and efficient banking. |
|
| ENABLED THROUGH | |||
| Attracting and rewarding the best talent with incentives aligned to strategic objectives | Our long-term success depends on our people. Channelling their ambition is critical to the successful realisation of our strategic aspirations. | ||
| Agile organisation and innovative culture | We continually enhance our ways of working. We are improving our culture by being nimbler, offering greater empowerment at all levels and reducing the number of siloes across the business. | ||
Key performance indicators
| KPI/STRATEGIC AIM | HOW WE MEASURE | 2017 | 2018 |
|---|---|---|---|
| Most valuable bank in the UAE | Total shareholder return (TSR) Calculated as the growth in share price, plus dividends paid to shareholders during the year. TSR is recognised as one of the best measures of shareholder returns. | 183% 5-YEAR TSR | 58% 5-YEAR TSR |
| Most profitable | Return on average equity (ROAE) Calculated as the profit attributable to equity shareholders as a percentage of average shareholders’ equity. To increase ROAE, we focus on growing our business where risk-adjusted returns are maximised and capital is efficiently deployed. | 15.0% | 16.3% |
| Most efficient | Cost-to-income ratio Calculated by dividing operating expenses by operating income. We are re-engineering our operational processes and increasing automation in order to do more with less. We are becoming more efficient, which provides greater scope to invest in our businesses. | 33.1% | 33.6% |
| Most resilient | Basic earnings per share (EPS) Calculated as profit attributed to equity shareholders, divided by the weighted average of the shares in issue during the year. | AED 0.80 | AED 0.90 |
| Best customer service | Net Promoter Score (NPS) NPS is based on the likelihood that customers will recommend ADCB to family or a friend. NPS is calculated as the percentage of customers who are promoters, rating ADCB a 9 or 10 on a 0 to 10-point scale, minus the percentage who are detractors, rating it 6 or lower. According to leading consultants, an increase of five points year on year is widely regarded as a significant achievement. | Since 2015 ADCB’s NPS Scores have improved significantly across all areas of the business (see below) | |
In our journey towards service excellence, we have been able to improve the NPS in each of the business segments over the past three years.
| Strategic NPS | Variation in NPS Points from 2015 |
|---|---|
| Corporate | +43 |
| Retail | +18 |
| Treasury & Investments | +28 |
In 2018, we invested in the following areas to enhance customer experience:
STAFF TRAINED IN SERVICE
CUSTOMERS SPOKEN TO FOR FEEDBACK
CUSTOMERS’ FEEDBACK ON DIGITAL PRODUCTS
STAFF PROVIDED FEEDBACK ON INTERNAL SERVICE PROVIDERS
MYSTERY SHOPPING AUDITS
CUSTOMER EXPERIENCE AND SERVICE QUALITY FORUMS
Recommended

Group CEO’s Message
I am proud to be part of an exceptional team of talented people across ADCB. Together, we have delivered a strong set of results...

Corporate Governance
ADCB is creating greater value for shareholders and making banking better for more than 800,000 customers.
Financial Overview
Our positive performance throughout 2018 demonstrates the effectiveness of our strategy and the enduring strength and resilience of the Bank.

Sustainability
As a major financial institution in the UAE, we are committed to sustainability, both within our own organisation and in the wider community.